Oom
Memory
I got a report recently that Dota2 was using too much memory on RADV. Host memory, that is, not GPU. So how does one profile Dota2 memory usage?
On Linux, the ideal tool for memory profiling is massif. But does a flawless, unparalleled game like Dota2 run under massif?
Sort of maybe almost but not really.
And it’s not the best way to do it anyway since, for profiling, the ideal scenario is to run a static test. Thus, gfxreconstruct is the best way to test things here. Simply VK_INSTANCE_LAYERS=VK_LAYER_LUNARG_gfxreconstruct in your ultra secret Source Engine debug console and let it run.
Then queue up a replay under massif and find something else to do for the next half hour since it’s not exactly a speedy process.
It Bad
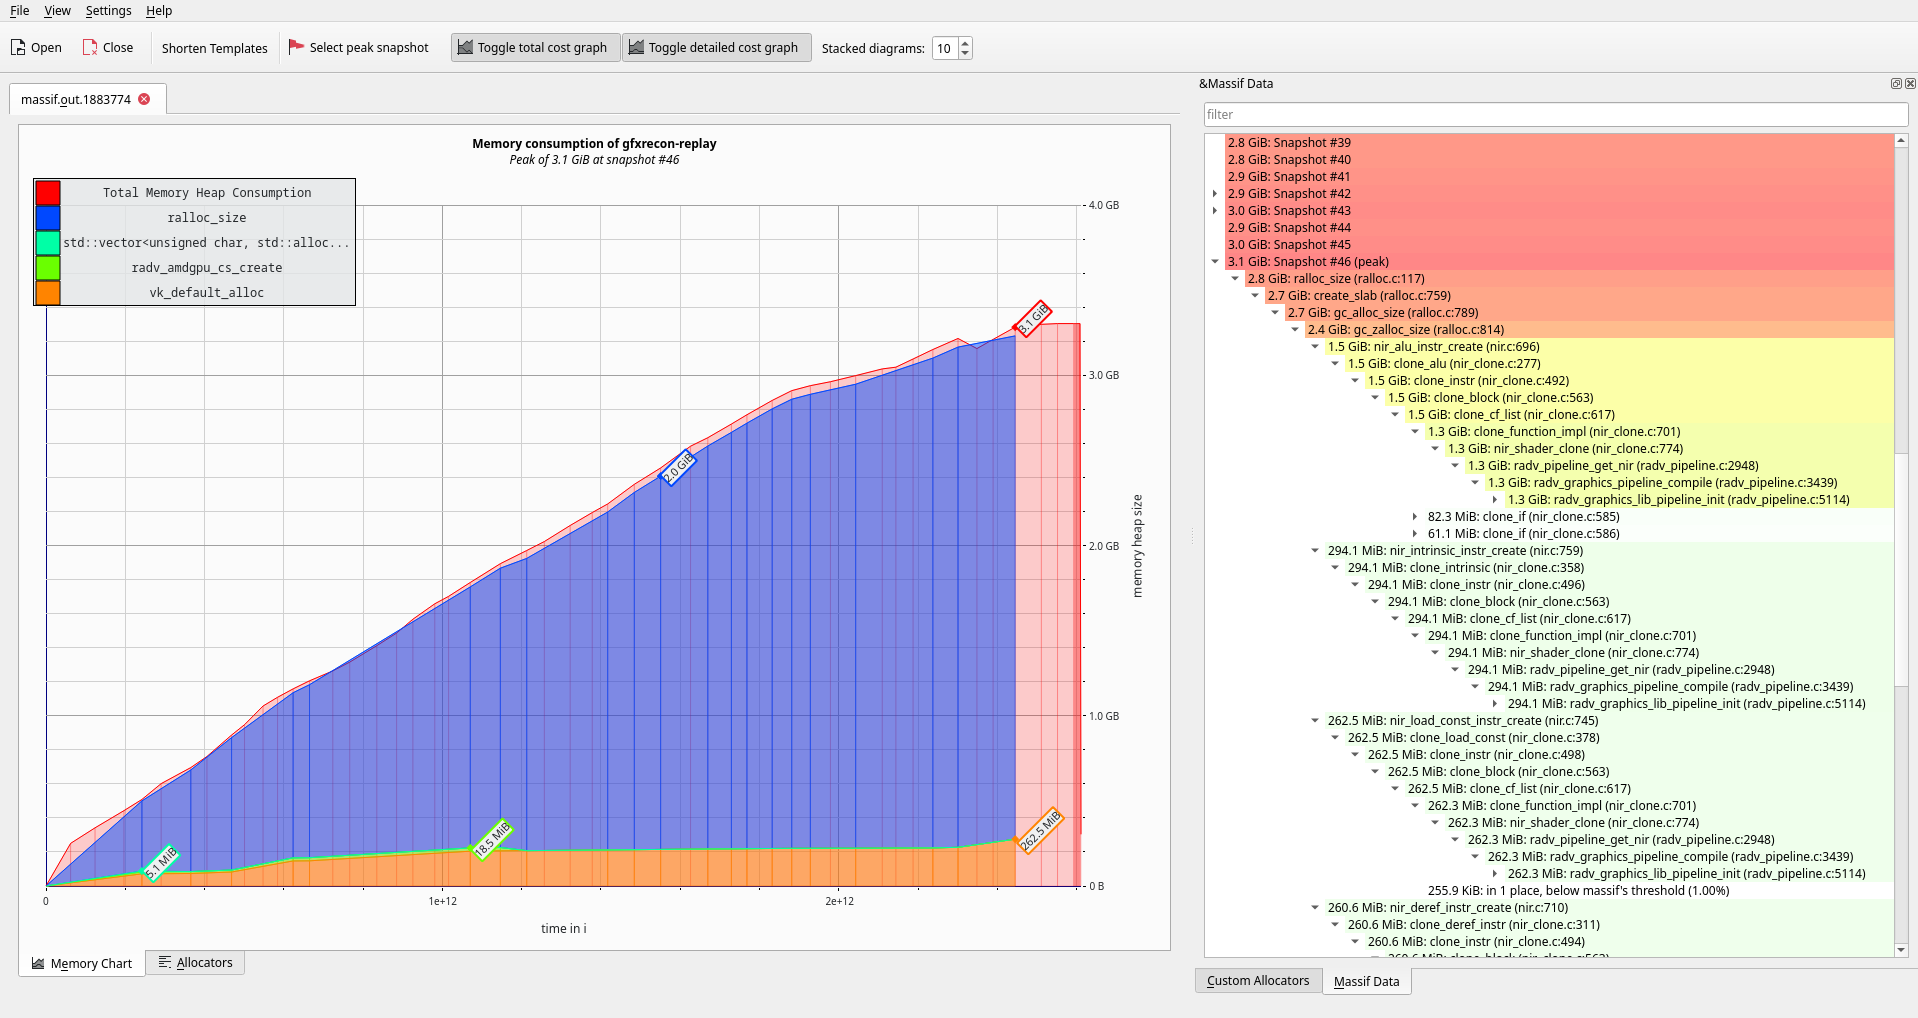
Opening up massif-visualizer, here’s what I saw just from getting to the Dota2 title screen:
Yikes.
3GiB memory utilization just from the driver? And nearly all of it just from in-memory shader IR?
How?
Simplified, this is a byproduct of VK_PIPELINE_CREATE_RETAIN_LINK_TIME_OPTIMIZATION_INFO_BIT_EXT with GPL (RADV_PERFTEST=gpl, definitely will be enabled by default in Mesa 23.1 or your money back). This bit requires that the driver keep around any internal data needed to later generate an optimized pipeline from the same sources as the fast-linked pipeline.
And RADV, like an overzealous hoarder, keeps those sources around in pristine condition, sucking up all your memory in the meanwhile.
S 🚀 A 🚀 M 🚀 U 🚀 E 🚀 L
As we know and expect, once the problem was revealed, noted Xtreme Coding World Champion Samuel Pitoiset sprang into action. Mesa uses NIR for its shader IR, and this infrastructure comes with its own convenient set of serialization (compression) utilities. By serializing the in-memory shaders, memory is saved.
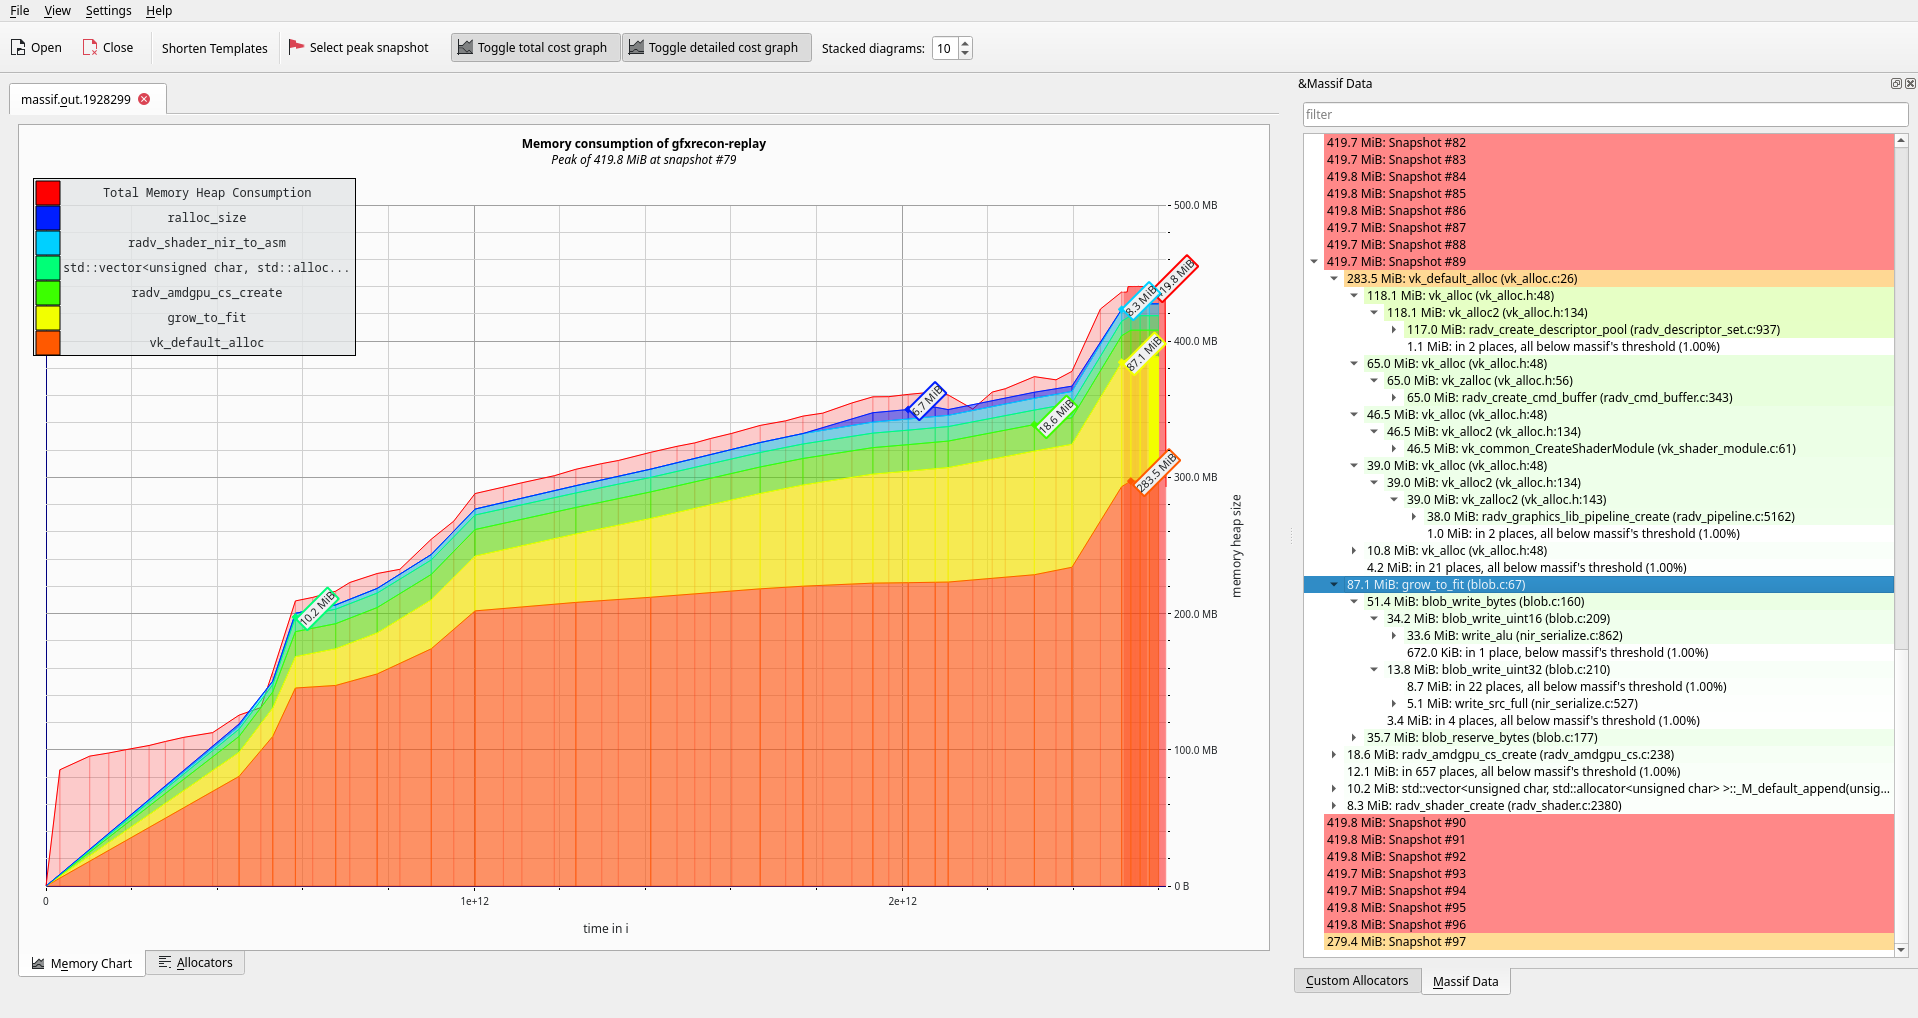
How much memory, you ask?
Yes, that’s an 85% reduction in memory utilization.
And it will soon land for everyone to enjoy.

